Analytics Use cases
Prometheus Metrics
From version 3.6.0, we are publishing the grafana dashboard file in json format, which can be taken from resource folder. Hagrid will emits the related metrics and can be visualise once grafana dashboard is imported.
Following metrics will be published
Application Metrics
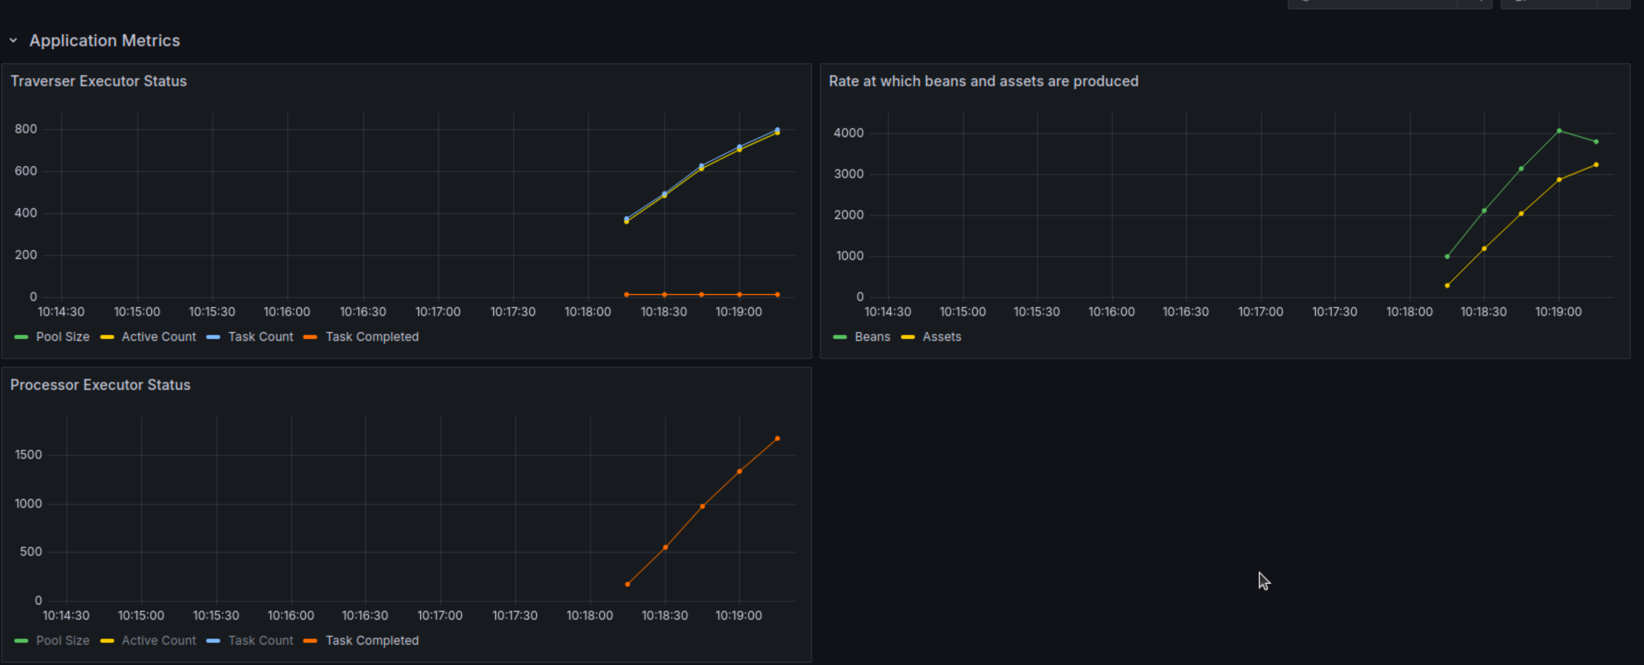
Application metrics refers to the metrics related to Traverser and Processor.
There are three metrics we are capturing
1. Traverser executor status - To understand traverser threads performance
2. Processor executor status - To understand processor threads performance
3. Performance of Traverser vs Processor - To understand overall how traverser and processor are performing
Infra Metrics
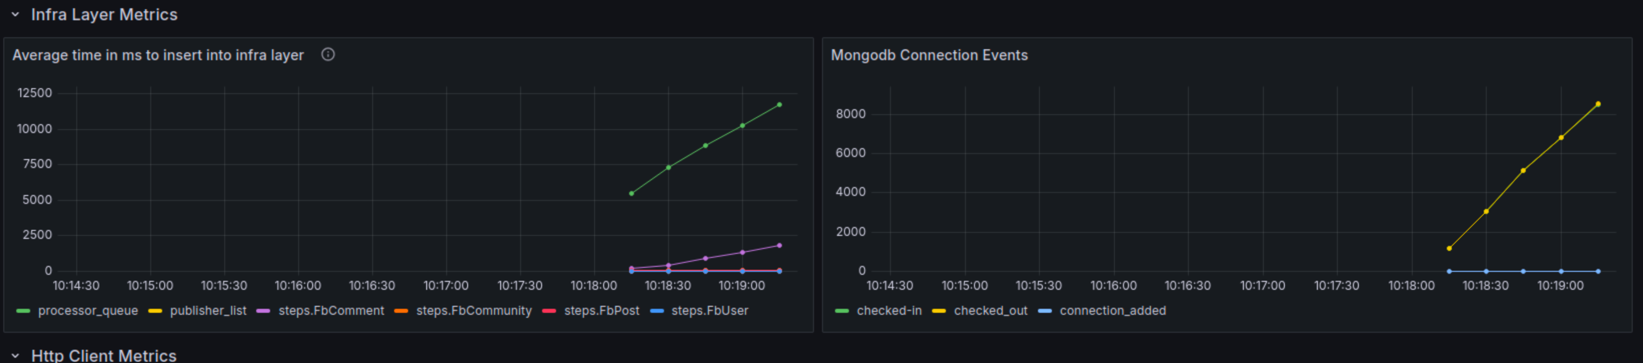
Infra metrics refers to how Hagrid's underline infra is performing Here we are capturing two metrics 1. Average time it is taking to add an json string into infra - Determine performance of underline infra 2. Mongo connection event - If developer has chosen Mongodb as underline infra then how connection pool is working
Http Client Metrics
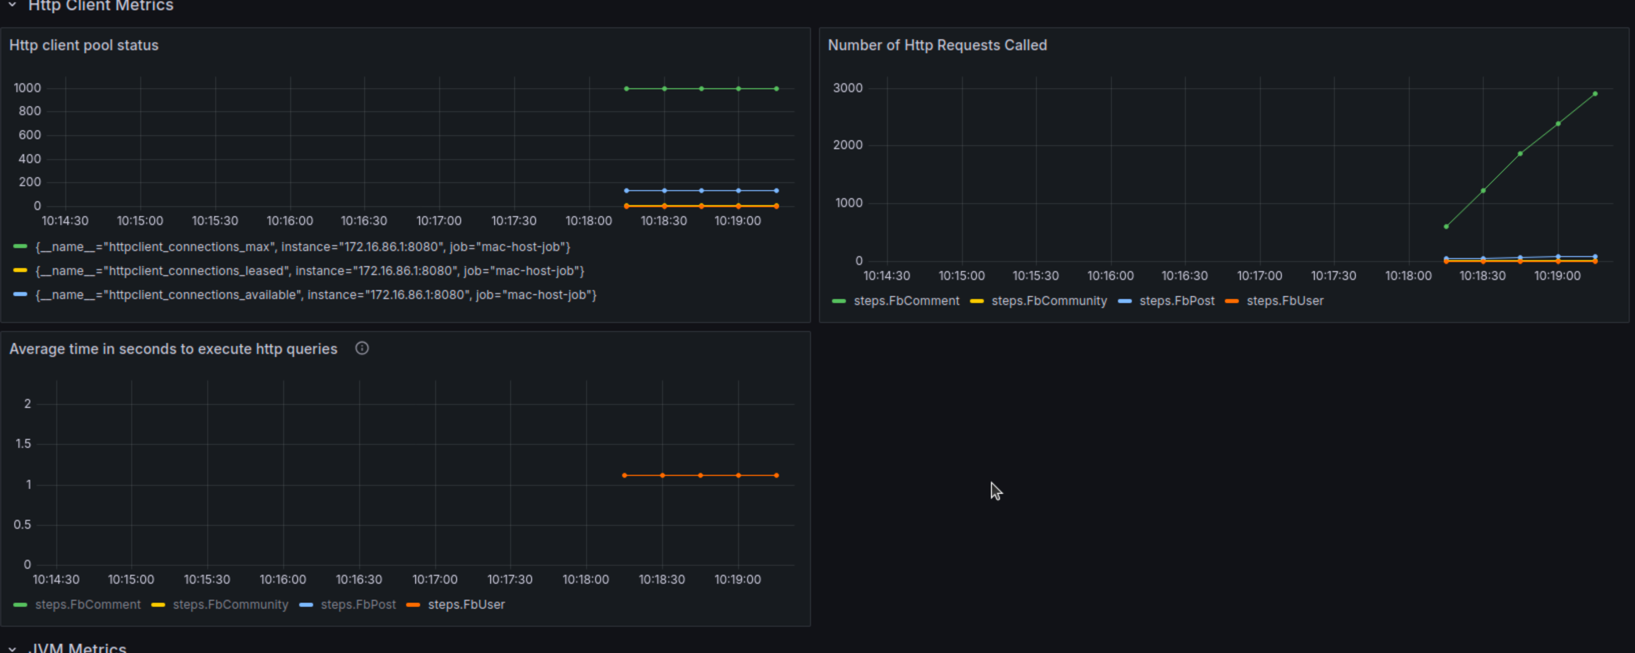
To understand how http client is performing when fetching data from third-party Here we capture three metrics 1. Http client pool 2. Number of http calls made 3. Average time taken to execute a http call
JVM Metrics
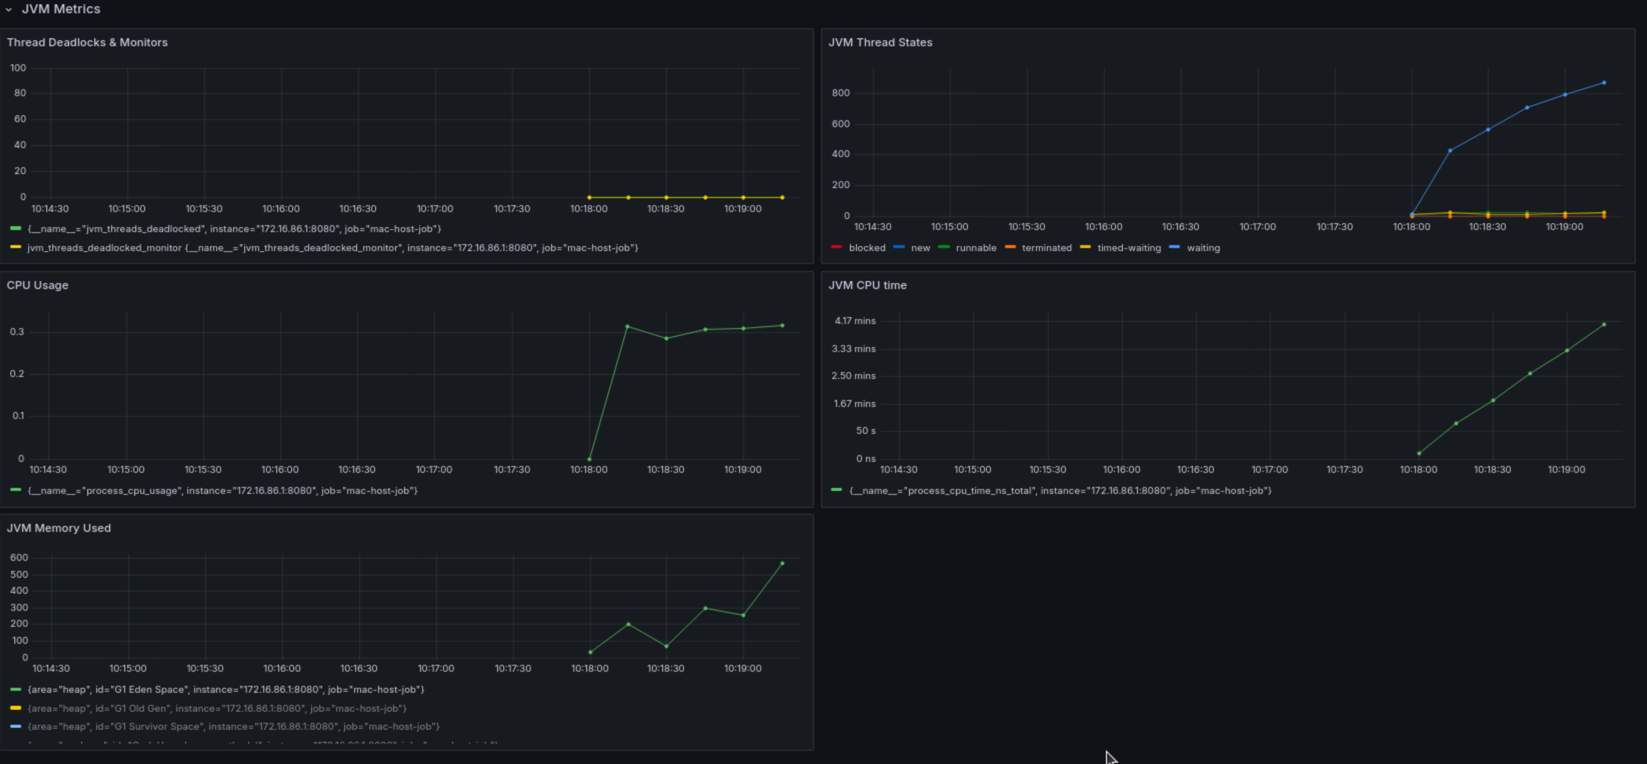
To understand JVM level performance, we have added following metrics 1. Thread Deadlocks and Monitor 2. JVM CPU 3. JVM Memory 4. JVM Thread States